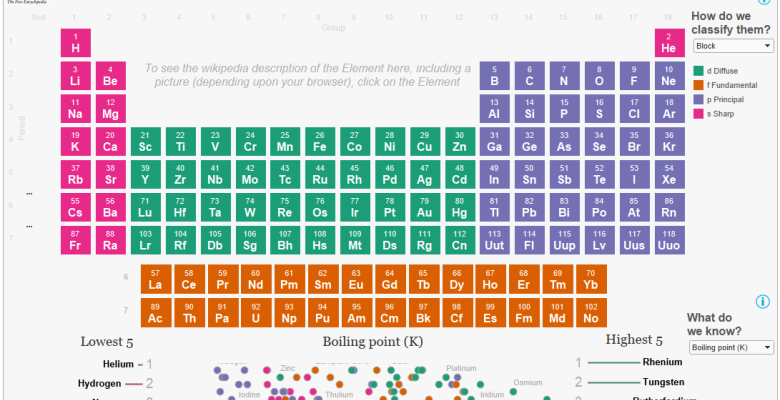
In Search of Fame and Glory in Las Vegas: Visualising the Periodic Table using Wikipedia data
March 21, 2015
Hi Folks, For this last week i’ve been on a quest to seek fame and glory (or at least a fre…
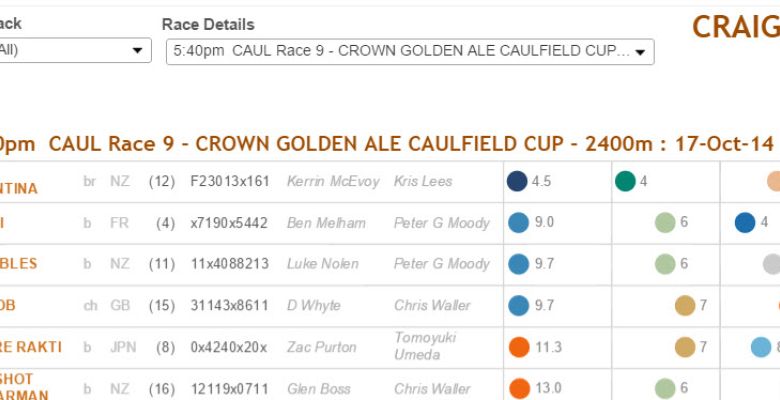
We’re off and Racing…..
October 18, 2014
Hello All, Have been doing some more data scraping (using import.io) of Horse Racing information …
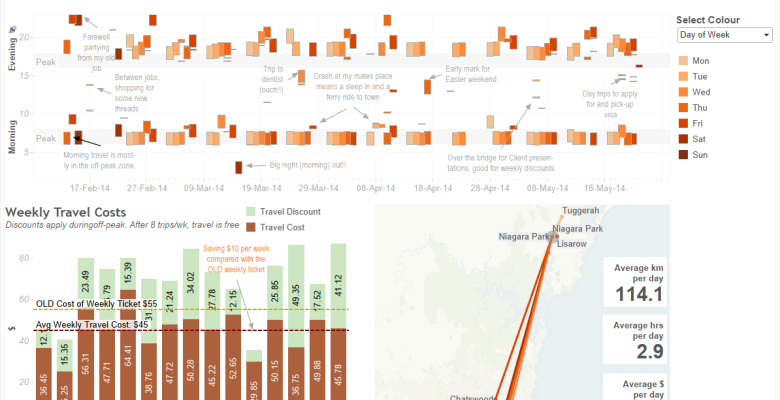
Quantifying my Self in a Viz
May 25, 2014
Hello All, I found out about the Tableau Quantified Self Viz Contest a bit late in the day, and i…
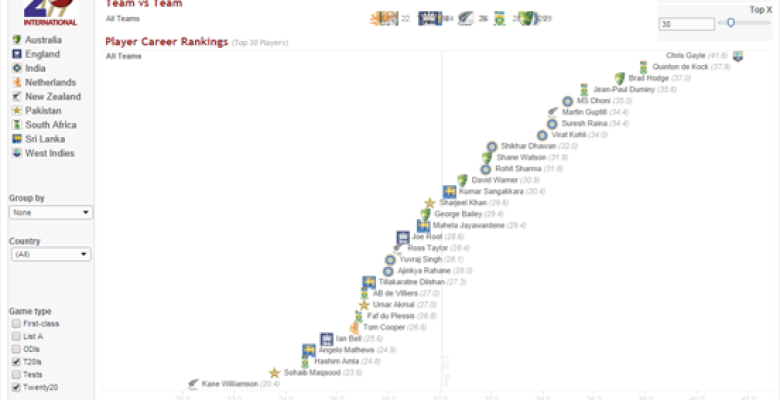
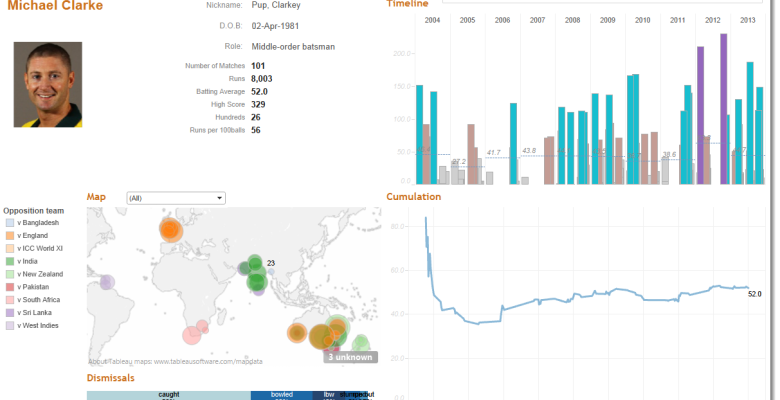
What do you do after 18,000+ games of cricket?
March 23, 2014
Hey there everyone! The Twenty20 Cricket World Cup is under way, and the final 10 teams have now …
Howzat for a Viz? : Publishing your Passion
January 26, 2014
Even though I had been using Tableau since early 2011, all of my creations had pretty much been f…
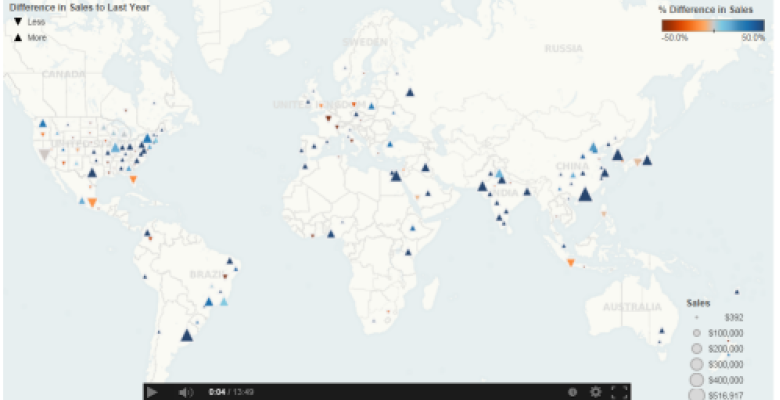
More or Less or The Same?
September 30, 2013
If you are looking to provide added value when presenting someone with a set of numbers, it is ve…
Data Scraping To Give Us the Inside Running
September 23, 2013
I’ve recently had a bash at data scraping and crawling – which is a mysterious black…
- 1
- 2

